Однозначно
Graphviz!
В AsciiDoc, например, есть плагин. Тогда прямо в тексте достаточно написать:
digraph {
    graph [rankdir=TD,ranksep=0.5,fontname=Arial]
    node [shape=box,fontname=Arial,fontsize=12,style="rounded"]
    edge [fontsize=8, fontname=Arial]

    user [shape=diamond, label="User", fillcolor=yellow, style="rounded,filled"]
    nginx [label="Nginx Web Server \n (http://ctxm.ornet.org)", style="bold,rounded"]
    jenkins [label="Jenkins"]
    nexus [label="Nexus"]
    sonar [label="Sonar"]
    postgres [label="PostgreSQL"]
    openldap [label="OpenLDAP"]
    volumes [label="volumes\n (data persisted here!)", constraint=false,color=gray, fillcolor=gray, style="rounded,filled"]

    user -> nginx[label="access", style=tapered, penwidth=3 ]

    nginx -> nexus[label="\/nexus"]
    nginx -> sonar[label="\/sonar"]
    nginx -> jenkins[label="\/jenkins"]
    nginx -> volumes [label="volumes-from",color=gray]
    openldap -> volumes [label="volumes-from",color=gray]
    postgres -> volumes [label="volumes-from",color=gray]
    jenkins -> openldap
    jenkins -> nexus
    jenkins -> volumes [label="volumes-from",color=gray]
    nexus -> openldap
    nexus -> volumes [label="volumes-from",color=gray]
    sonar -> postgres
    sonar -> openldap
    sonar -> volumes [label="volumes-from",color=gray]
}
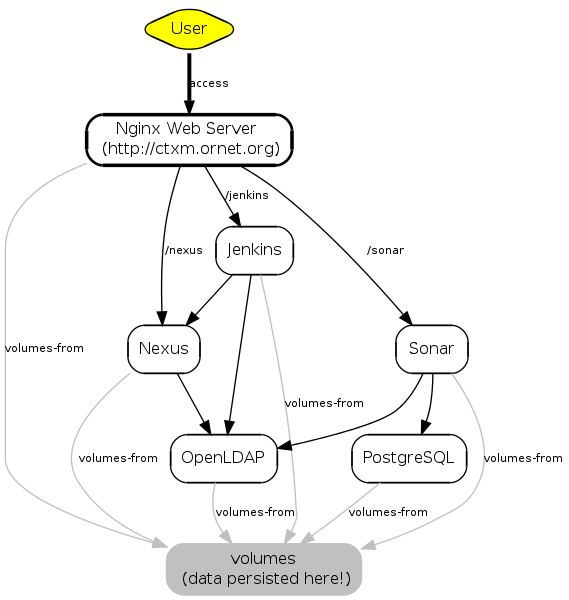
А на выходе это даст картинку:

