today = date.today()
datetime.strftime( datetime.strptime(today.strftime('%Y-%m-%d'),'%Y-%m-%d'),"%Y-%m-%d")for i in range(21):
day = date_pr.strftime("%A")plt.hist(lst, histtype='step', cumulative=True, bins=len(lst))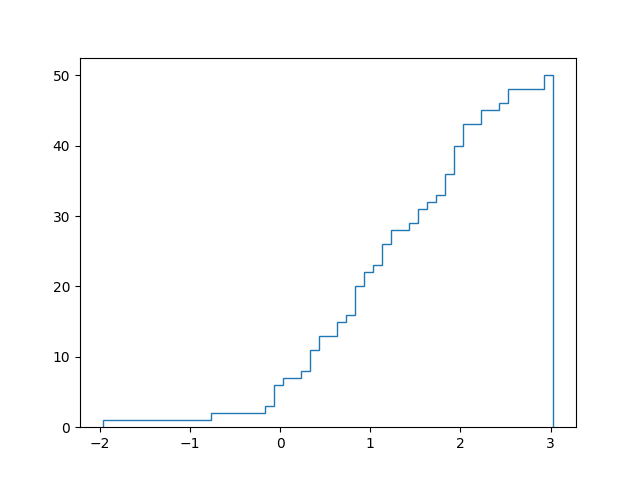
bin_dt, bin_gr = np.histogram(lst, bins=len(lst))
Y = bin_dt.cumsum()
for i in range(len(Y)):
    plt.plot([bin_gr[i], bin_gr[i+1]],[Y[i], Y[i]],color='green')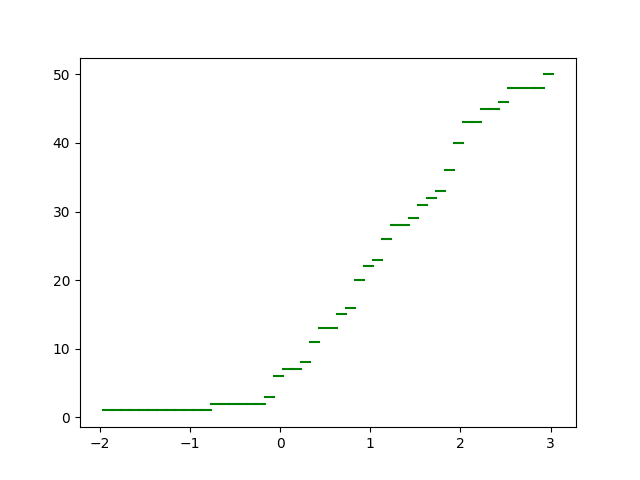
import seaborn as sns
sns.kdeplot(lst, cumulative=True)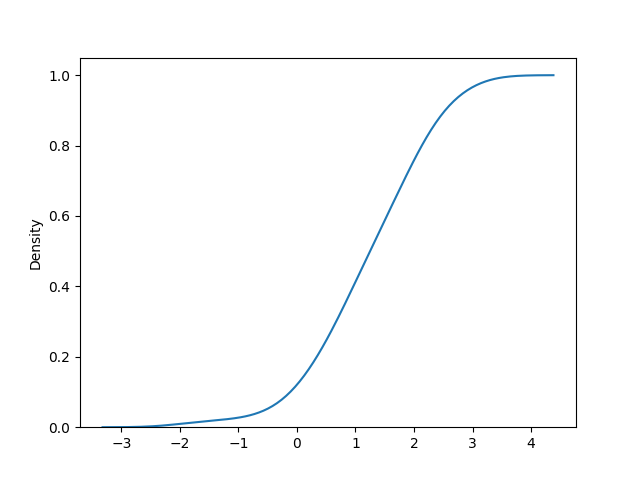
from main import collect_data lst=[]
while True:
lst.append(int(input()))
if len(lst)%2==0:
print(lst[-2],lst[-1])fig, ax = plt.subplots(1, 3)ax[0].imshow(....)ax[2].imshow(...)ax[1].plot()if row.targer.str.startswith("0"):
old_result=row.result
df.loc[index, "result"] = "0"+ old_resultif row.targer.str.startswith("0"):s_diff=set(sp_fl_1)-set(sp_fl_2)value[:[i for i in range(len(value)) if value[i] < 0][0]])[:[i for i in range(len(value)) if value[i] < 0[0]])[i for i in range(len(value)) if value[i] < 0]value[:[i for i in range(len(value)) if value[i] < 0][0]]import pandas as pd
def f(row):
if len(row['TYPE'])>4 :
rt = row['TYPE'][0:5]
else:
rt = row['TYPE']
return rt
df=pd.DataFrame({'TYPE':('17.21' ,'47.75.1','68.20.2')})
df['TYPE_NEW'] = df.apply(f, axis=1)TYPE TYPE_NEW
0 17.21 17.21
1 47.75.1 47.75
2 68.20.2 68.20import numpy as np
import matplotlib.pyplot as plt
dots = np.array([[1, 8], [1, 10], [2, 11], [3, 10], [3, 14], [4, 8], [5, 5], [5, 11], [5, 18], [6, 4], [8, 4], [10, 7], [10, 9], [10, 4], [11, 7], [11, 3], [12, 5], [12, 8], [12, 10], [12, 7], [14, 6], [14, 8], [16, 16], [16, 18], [17, 21], [18, 16], [18, 18], [18, 21], [19, 2], [19, 4], [19, 8], [19, 12], [19, 16], [19, 17], [19, 20], [20, 1], [20, 3], [20, 6], [20, 15], [20, 17], [21, 3], [21, 4], [21, 12], [21, 16], [21, 18], [21, 20], [22, 3], [22, 4], [22, 5], [22, 6]])
x=[i[0] for i in dots]
y=[i[1] for i in dots]
fig = plt.figure()
ax = fig.add_subplot(111)
ax.plot(x,y, 'o')
ax.set_xlabel('x-points')
ax.set_ylabel('y-points')
ax.set_title('Simple XY point plot')
fig.show()