Заметил, что мой ноут стал тянуть с запуском после загрузки логотипа. Произошло это неделю назад. Появляется только один раз в день. Вот что выдала WinDbg:
************* Preparing the environment for Debugger Extensions Gallery repositories **************
   ExtensionRepository : Implicit
   UseExperimentalFeatureForNugetShare : false
   AllowNugetExeUpdate : false
   AllowNugetMSCredentialProviderInstall : false
   AllowParallelInitializationOfLocalRepositories : true

   -- Configuring repositories
      ----> Repository : LocalInstalled, Enabled: true
      ----> Repository : UserExtensions, Enabled: true

>>>>>>>>>>>>> Preparing the environment for Debugger Extensions Gallery repositories completed, duration 0.000 seconds

************* Waiting for Debugger Extensions Gallery to Initialize **************

>>>>>>>>>>>>> Waiting for Debugger Extensions Gallery to Initialize completed, duration 0.046 seconds
   ----> Repository : UserExtensions, Enabled: true, Packages count: 0
   ----> Repository : LocalInstalled, Enabled: true, Packages count: 36

Microsoft (R) Windows Debugger Version 10.0.25877.1004 AMD64
Copyright (c) Microsoft Corporation. All rights reserved.


Loading Dump File [C:\Windows\Minidump\012324-11203-01.dmp]
Mini Kernel Dump File: Only registers and stack trace are available


************* Path validation summary **************
Response                         Time (ms)     Location
Deferred                                       srv*
Symbol search path is: srv*
Executable search path is:
Windows 10 Kernel Version 19041 MP (8 procs) Free x64
Product: WinNt, suite: TerminalServer SingleUserTS Personal
Kernel base = 0xfffff801`44c00000 PsLoadedModuleList = 0xfffff801`4582a790
Debug session time: Tue Jan 23 16:21:24.957 2024 (UTC + 3:00)
System Uptime: 2 days 2:44:46.702
Loading Kernel Symbols
...............................................................
................................................................
................................................................
....................................................
Loading User Symbols

Loading unloaded module list
..................................................
For analysis of this file, run !analyze -v
nt!KeBugCheckEx:
fffff801`44ffd6f0 48894c2408      mov     qword ptr [rsp+8],rcx ss:ffff8600`956d48f0=????????????????
1: kd> !analyze -v
*******************************************************************************
*                                                                             *
*                        Bugcheck Analysis                                    *
*                                                                             *
*******************************************************************************

WHEA_UNCORRECTABLE_ERROR (124)
A fatal hardware error has occurred. Parameter 1 identifies the type of error
source that reported the error. Parameter 2 holds the address of the
nt!_WHEA_ERROR_RECORD structure that describes the error condition. Try !errrec Address of the nt!_WHEA_ERROR_RECORD structure to get more details.
Arguments:
Arg1: 0000000000000000, Machine Check Exception
Arg2: ffffc809b8007028, Address of the nt!_WHEA_ERROR_RECORD structure.
Arg3: 00000000fe000000, High order 32-bits of the MCi_STATUS value.
Arg4: 0000000000800400, Low order 32-bits of the MCi_STATUS value.

Debugging Details:
------------------

*************************************************************************
***                                                                   ***
***                                                                   ***
***    Either you specified an unqualified symbol, or your debugger   ***
***    doesn't have full symbol information.  Unqualified symbol      ***
***    resolution is turned off by default. Please either specify a   ***
***    fully qualified symbol module!symbolname, or enable resolution ***
***    of unqualified symbols by typing ".symopt- 100". Note that     ***
***    enabling unqualified symbol resolution with network symbol     ***
***    server shares in the symbol path may cause the debugger to     ***
***    appear to hang for long periods of time when an incorrect      ***
***    symbol name is typed or the network symbol server is down.     ***
***                                                                   ***
***    For some commands to work properly, your symbol path           ***
***    must point to .pdb files that have full type information.      ***
***                                                                   ***
***    Certain .pdb files (such as the public OS symbols) do not      ***
***    contain the required information.  Contact the group that      ***
***    provided you with these symbols if you need this command to    ***
***    work.                                                          ***
***                                                                   ***
***    Type referenced: hal!_WHEA_PROCESSOR_GENERIC_ERROR_SECTION                ***
***                                                                   ***
*************************************************************************
*************************************************************************
***                                                                   ***
***                                                                   ***
***    Either you specified an unqualified symbol, or your debugger   ***
***    doesn't have full symbol information.  Unqualified symbol      ***
***    resolution is turned off by default. Please either specify a   ***
***    fully qualified symbol module!symbolname, or enable resolution ***
***    of unqualified symbols by typing ".symopt- 100". Note that     ***
***    enabling unqualified symbol resolution with network symbol     ***
***    server shares in the symbol path may cause the debugger to     ***
***    appear to hang for long periods of time when an incorrect      ***
***    symbol name is typed or the network symbol server is down.     ***
***                                                                   ***
***    For some commands to work properly, your symbol path           ***
***    must point to .pdb files that have full type information.      ***
***                                                                   ***
***    Certain .pdb files (such as the public OS symbols) do not      ***
***    contain the required information.  Contact the group that      ***
***    provided you with these symbols if you need this command to    ***
***    work.                                                          ***
***                                                                   ***
***    Type referenced: hal!_WHEA_PROCESSOR_GENERIC_ERROR_SECTION                ***
***                                                                   ***
*************************************************************************

KEY_VALUES_STRING: 1

    Key  : Analysis.CPU.mSec
    Value: 3124

    Key  : Analysis.Elapsed.mSec
    Value: 3875

    Key  : Analysis.IO.Other.Mb
    Value: 0

    Key  : Analysis.IO.Read.Mb
    Value: 0

    Key  : Analysis.IO.Write.Mb
    Value: 0

    Key  : Analysis.Init.CPU.mSec
    Value: 405

    Key  : Analysis.Init.Elapsed.mSec
    Value: 6209

    Key  : Analysis.Memory.CommitPeak.Mb
    Value: 87

    Key  : Bugcheck.Code.LegacyAPI
    Value: 0x124

    Key  : Dump.Attributes.AsUlong
    Value: 8

    Key  : Dump.Attributes.KernelGeneratedTriageDump
    Value: 1

    Key  : Failure.Bucket
    Value: 0x124_0_GenuineIntel_PROCESSOR__UNKNOWN_IMAGE_GenuineIntel.sys

    Key  : Failure.Hash
    Value: {5371cb52-c3d9-558e-47d4-d31c09567ca2}


BUGCHECK_CODE:  124

BUGCHECK_P1: 0

BUGCHECK_P2: ffffc809b8007028

BUGCHECK_P3: fe000000

BUGCHECK_P4: 800400

FILE_IN_CAB:  012324-11203-01.dmp

DUMP_FILE_ATTRIBUTES: 0x8
  Kernel Generated Triage Dump

BLACKBOXBSD: 1 (!blackboxbsd)


BLACKBOXNTFS: 1 (!blackboxntfs)


BLACKBOXPNP: 1 (!blackboxpnp)


BLACKBOXWINLOGON: 1

CUSTOMER_CRASH_COUNT:  1

PROCESS_NAME:  System

STACK_TEXT:
ffff8600`956d48e8 00000000`00000000     : 00000000`00000000 00000000`00000000 00000000`00000000 00000000`00000000 : nt!KeBugCheckEx


MODULE_NAME: GenuineIntel

IMAGE_NAME:  GenuineIntel.sys

STACK_COMMAND:  .cxr; .ecxr ; kb

FAILURE_BUCKET_ID:  0x124_0_GenuineIntel_PROCESSOR__UNKNOWN_IMAGE_GenuineIntel.sys

OSPLATFORM_TYPE:  x64

OSNAME:  Windows 10

FAILURE_ID_HASH:  {5371cb52-c3d9-558e-47d4-d31c09567ca2}

Followup:     MachineOwner
---------
Файл
дампа
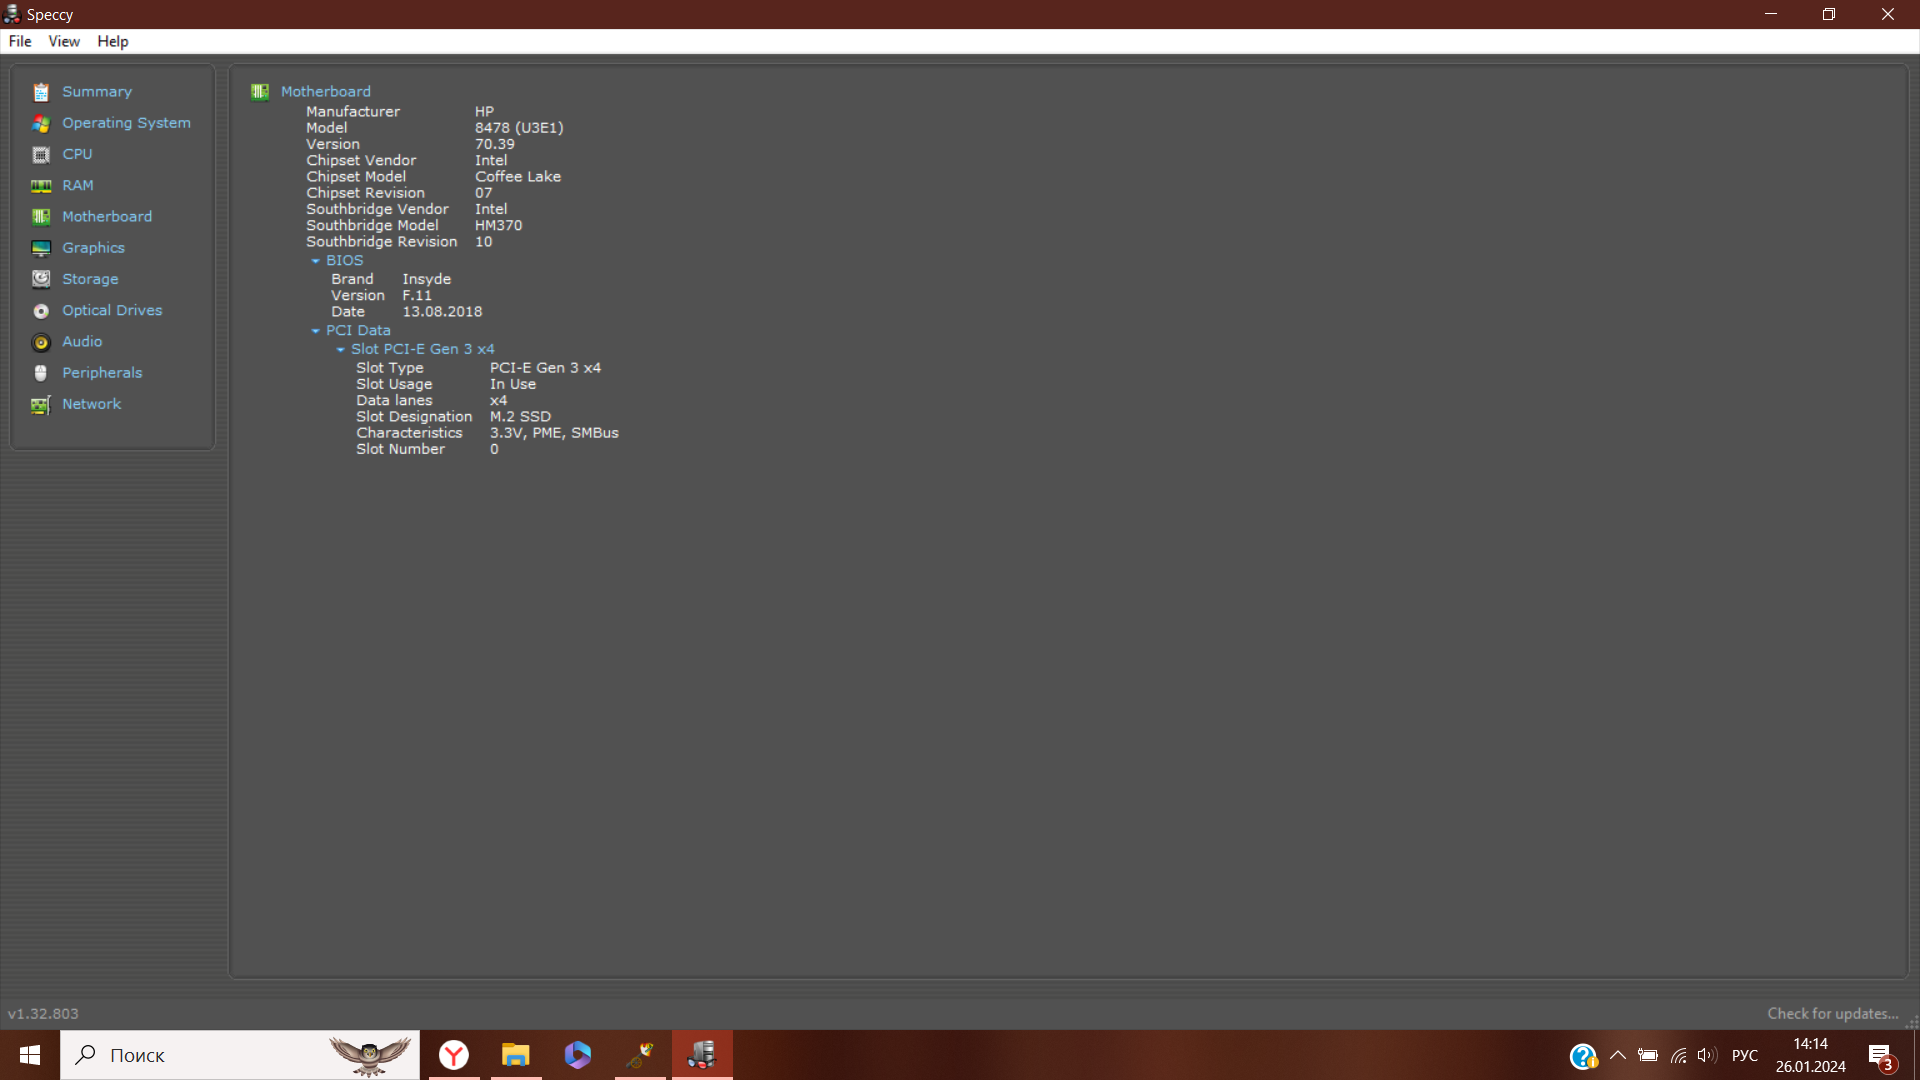
Ноут HP Pavilion Gaming Laptop 15-cx0098ur (4 года)
Windows 10 Home SL 64bit 22h2
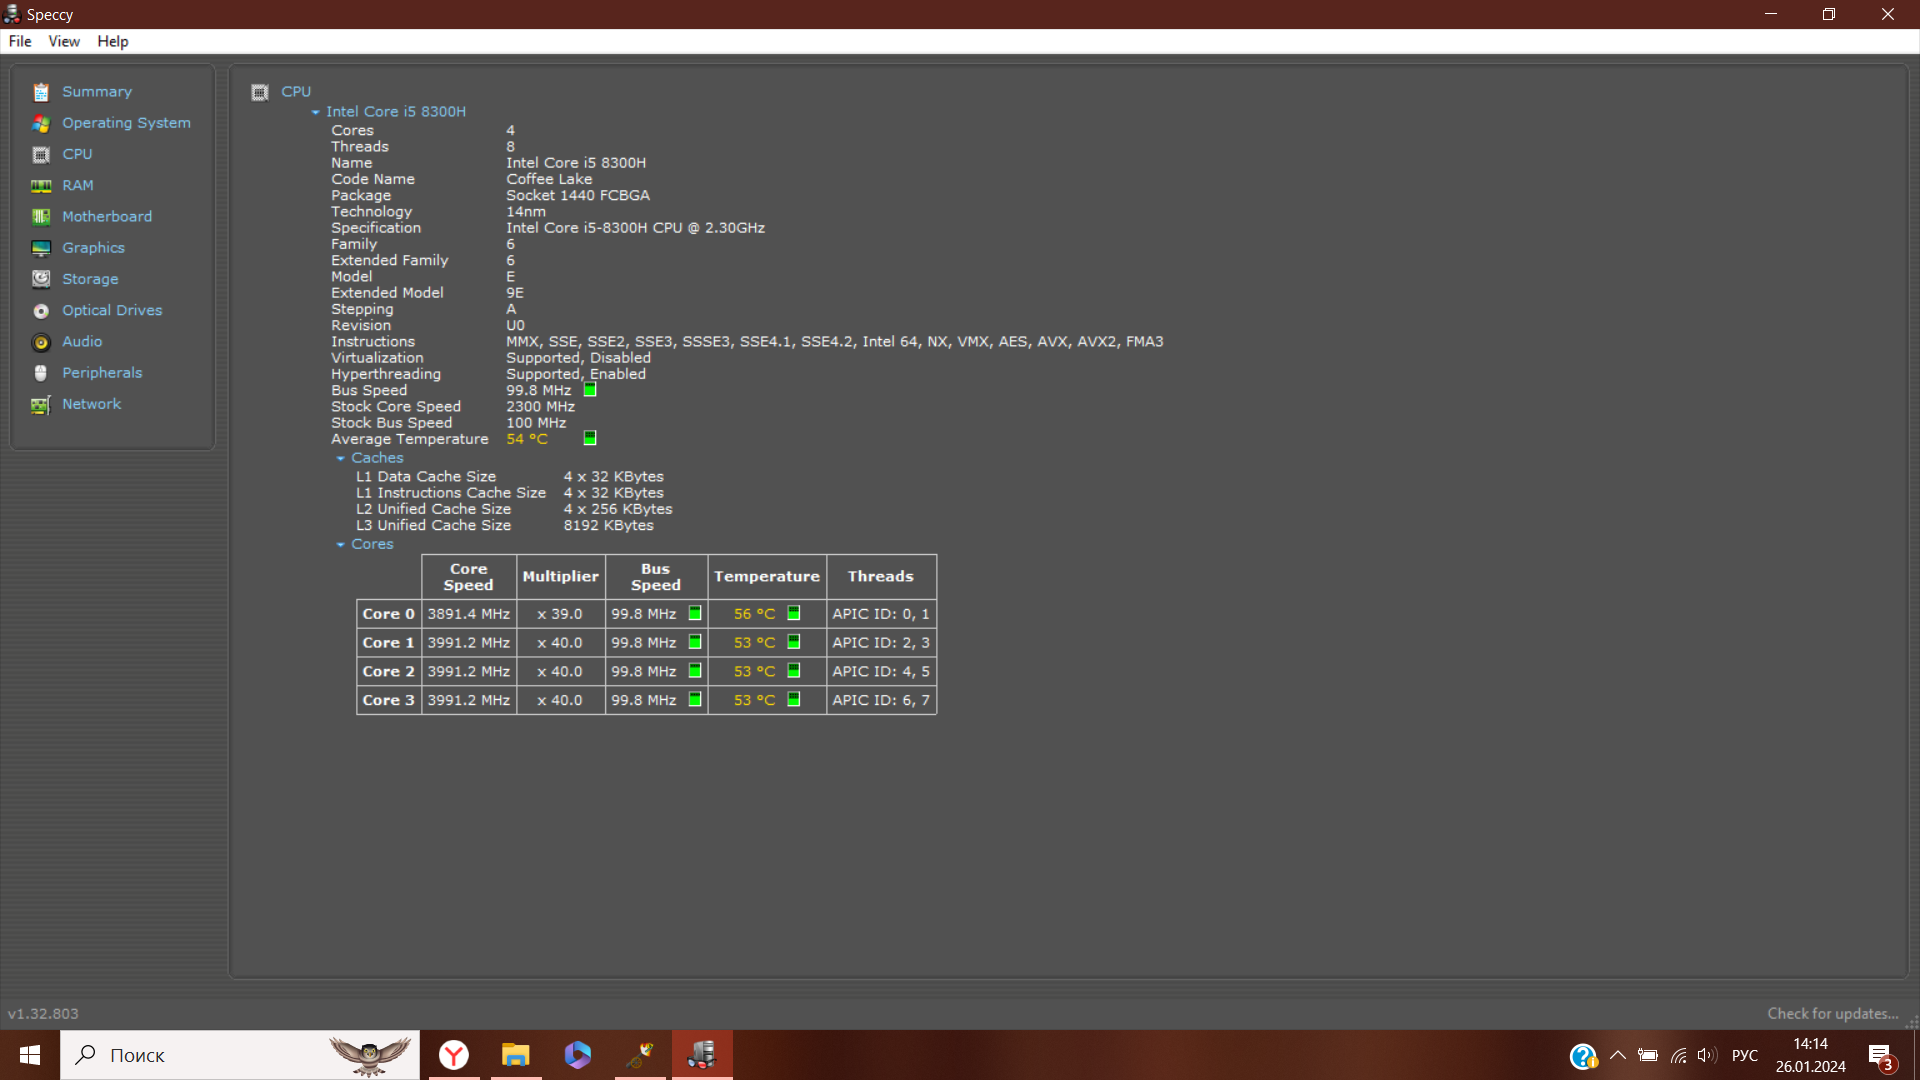
Intel Core i5-8300h
Intel UHD Graphics 630 (драйвер 31.0.101.2125)
NVIDIA GeForce 1060 MaxQ (драйвер 546.65)
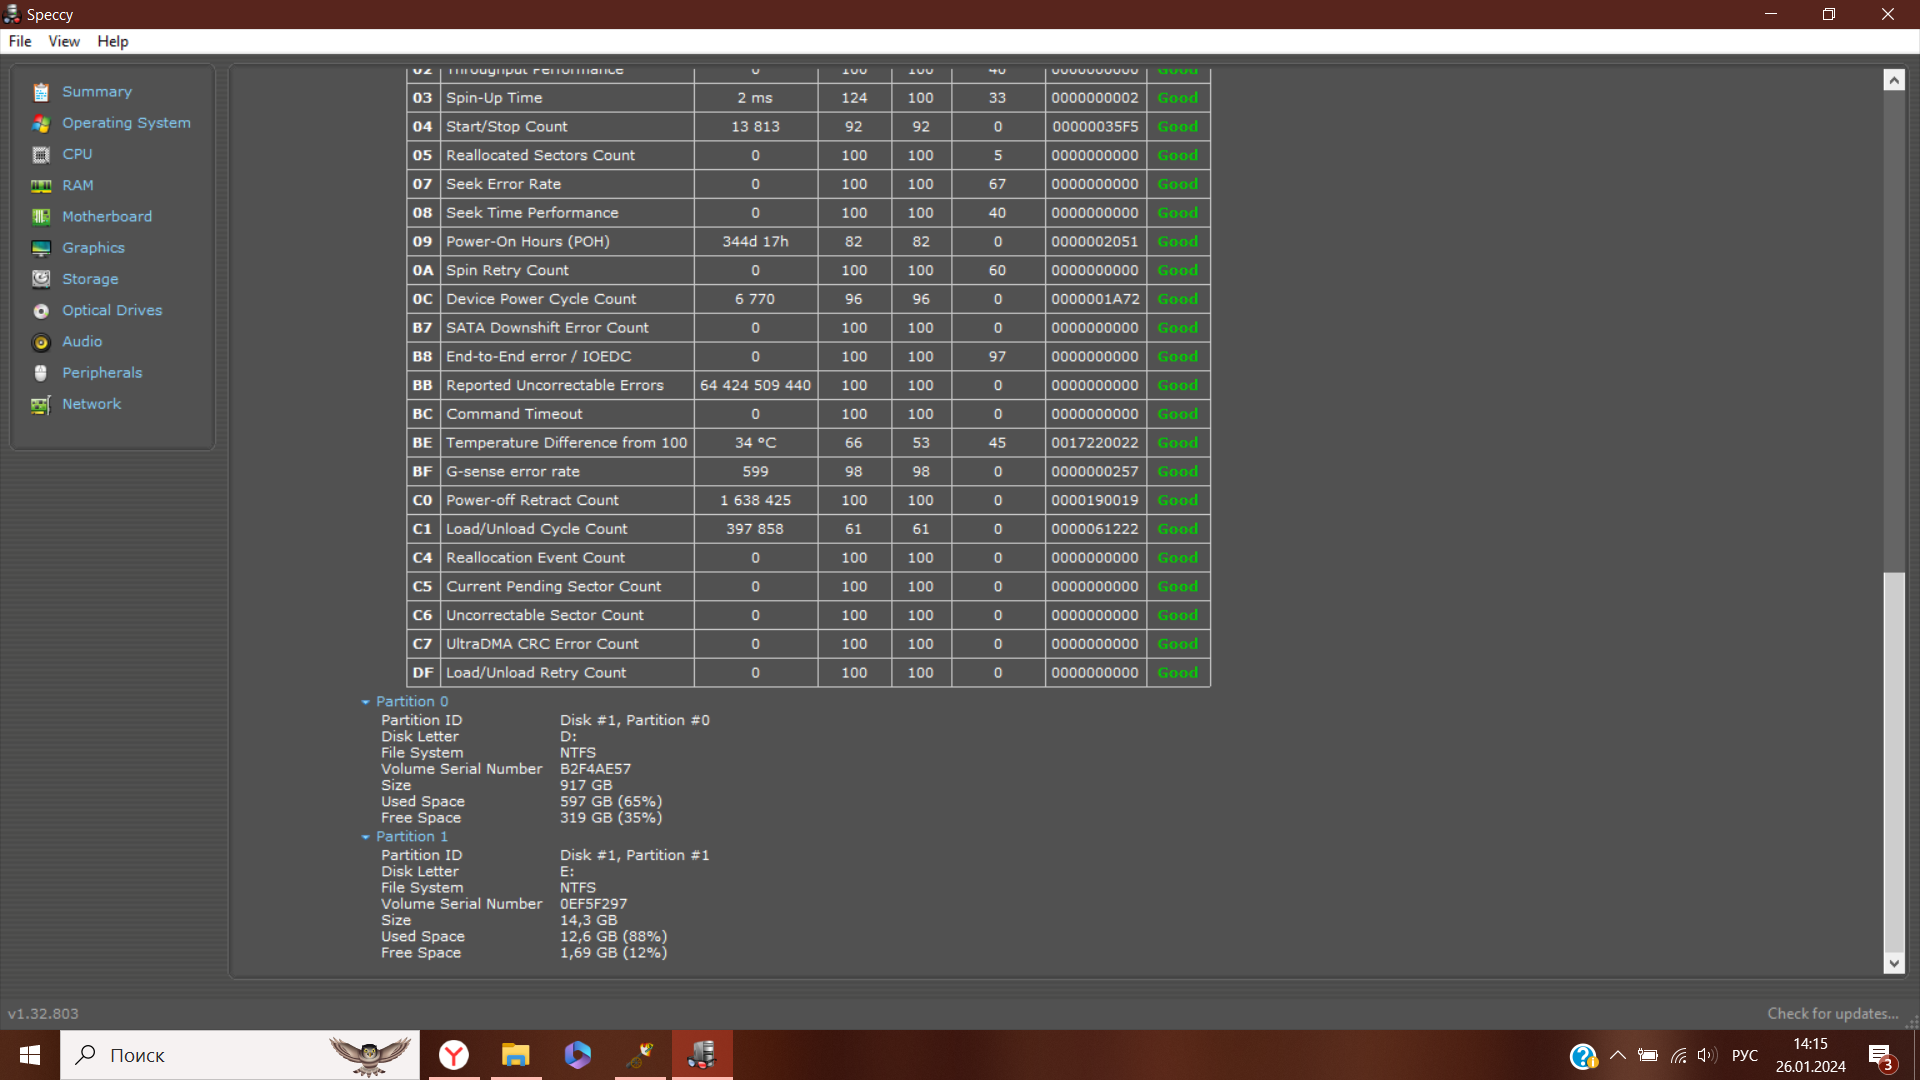
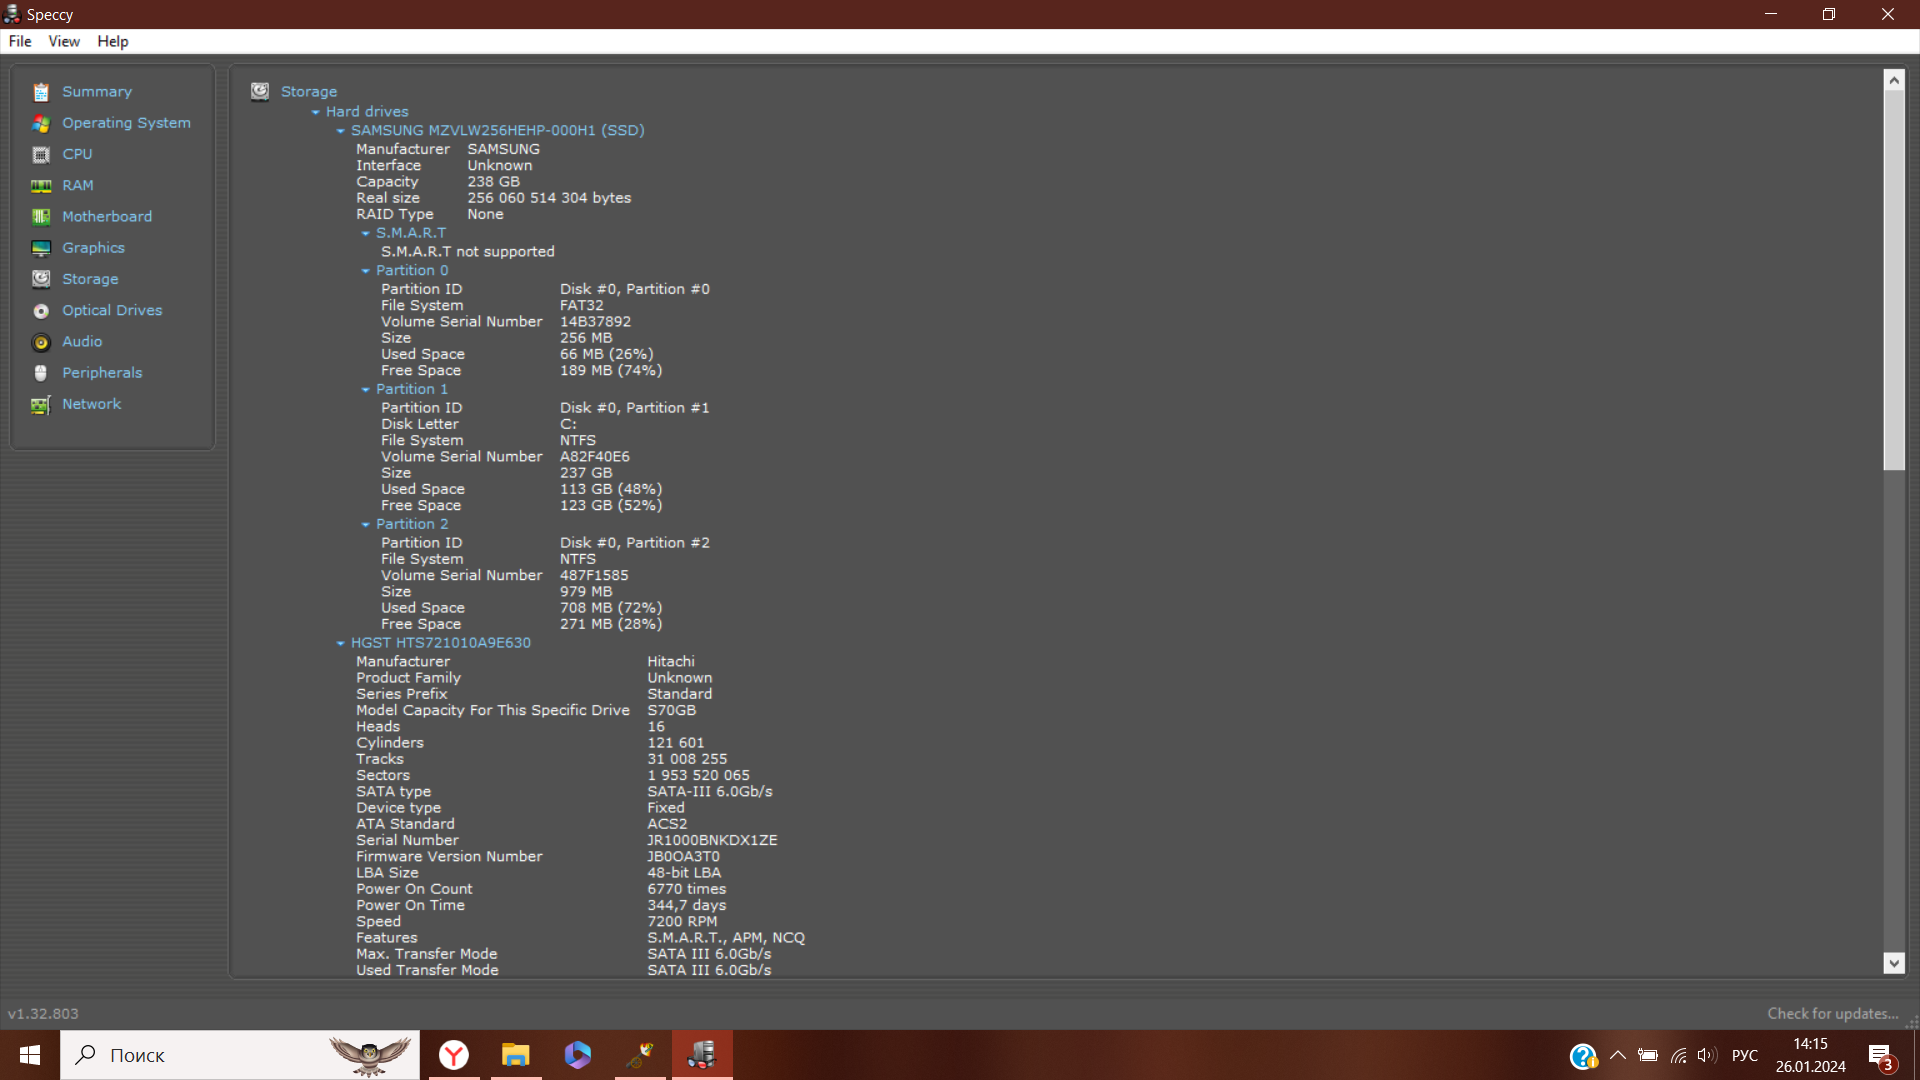
238GB SAMSUNG MZVLW256HEHP-000H1 (Unknown (SSD))
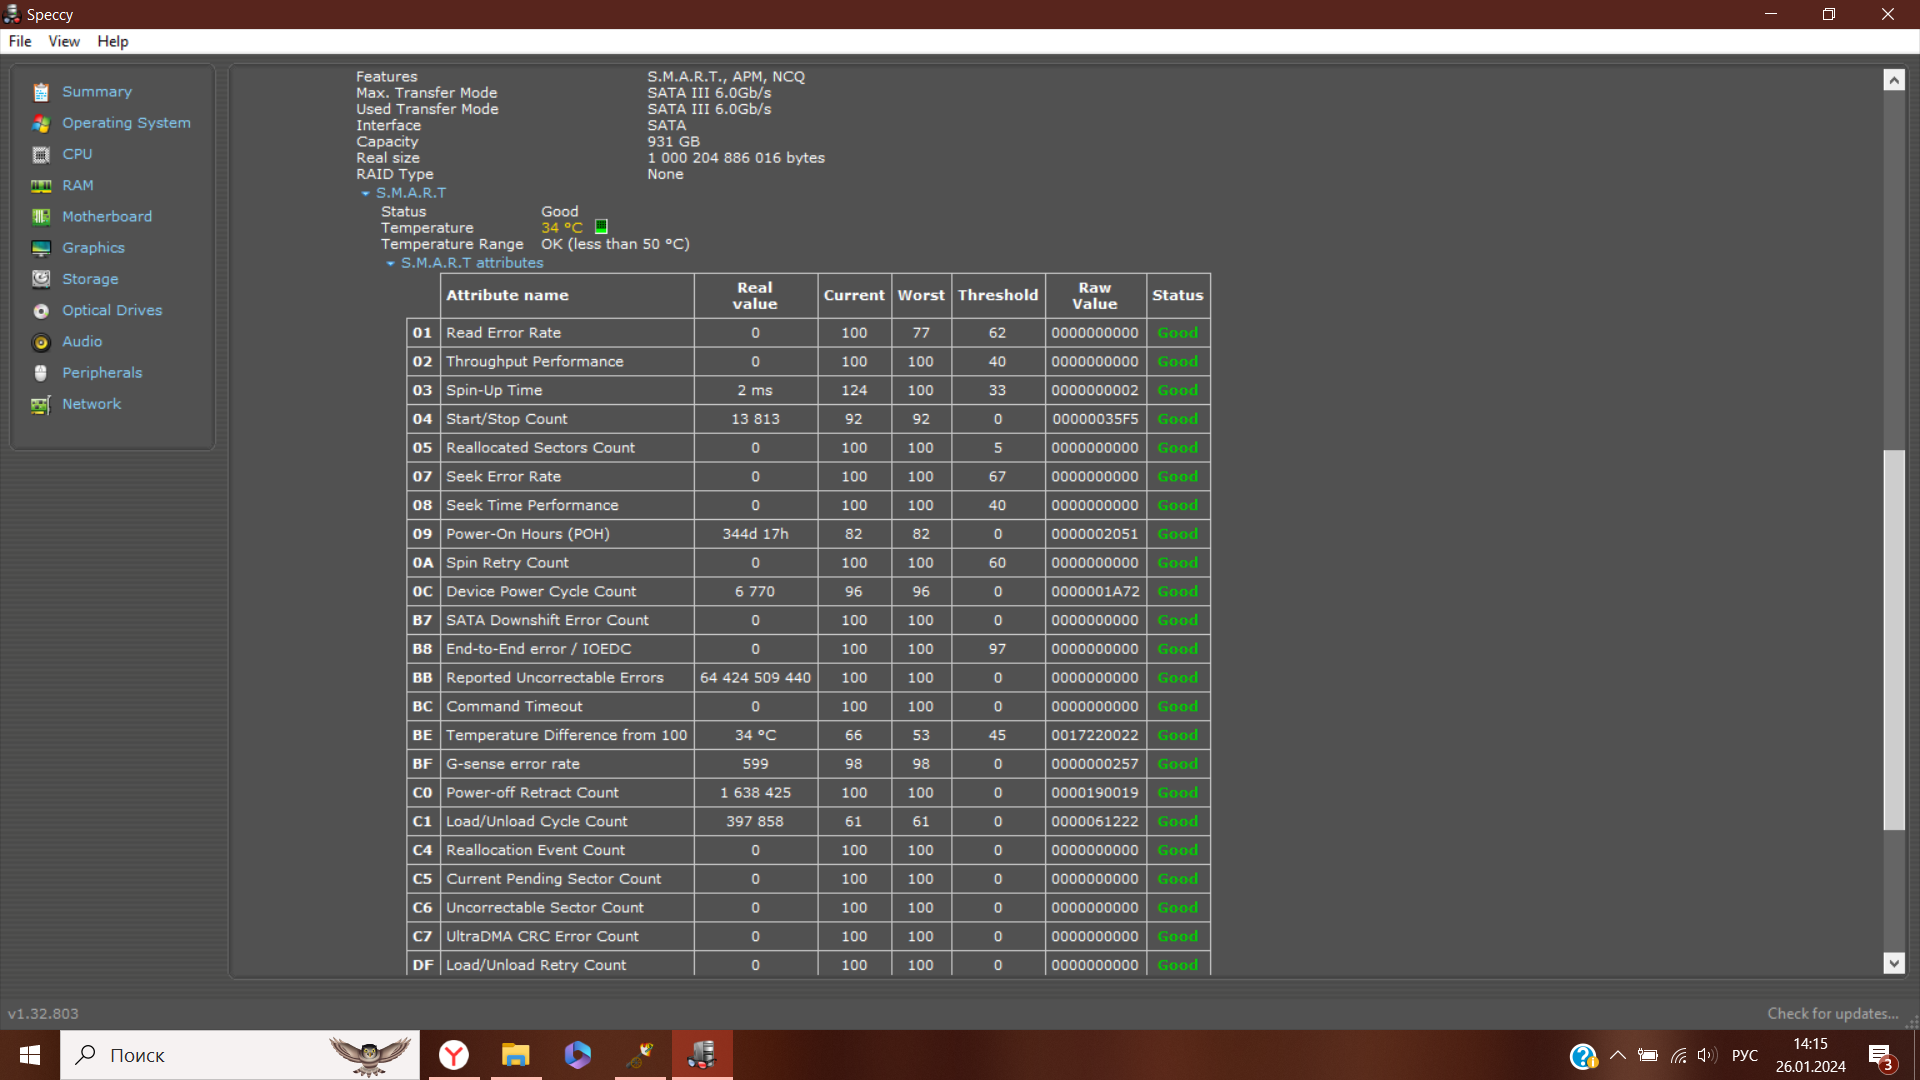
931GB Hitachi HGST HTS721010A9E630 (SATA )
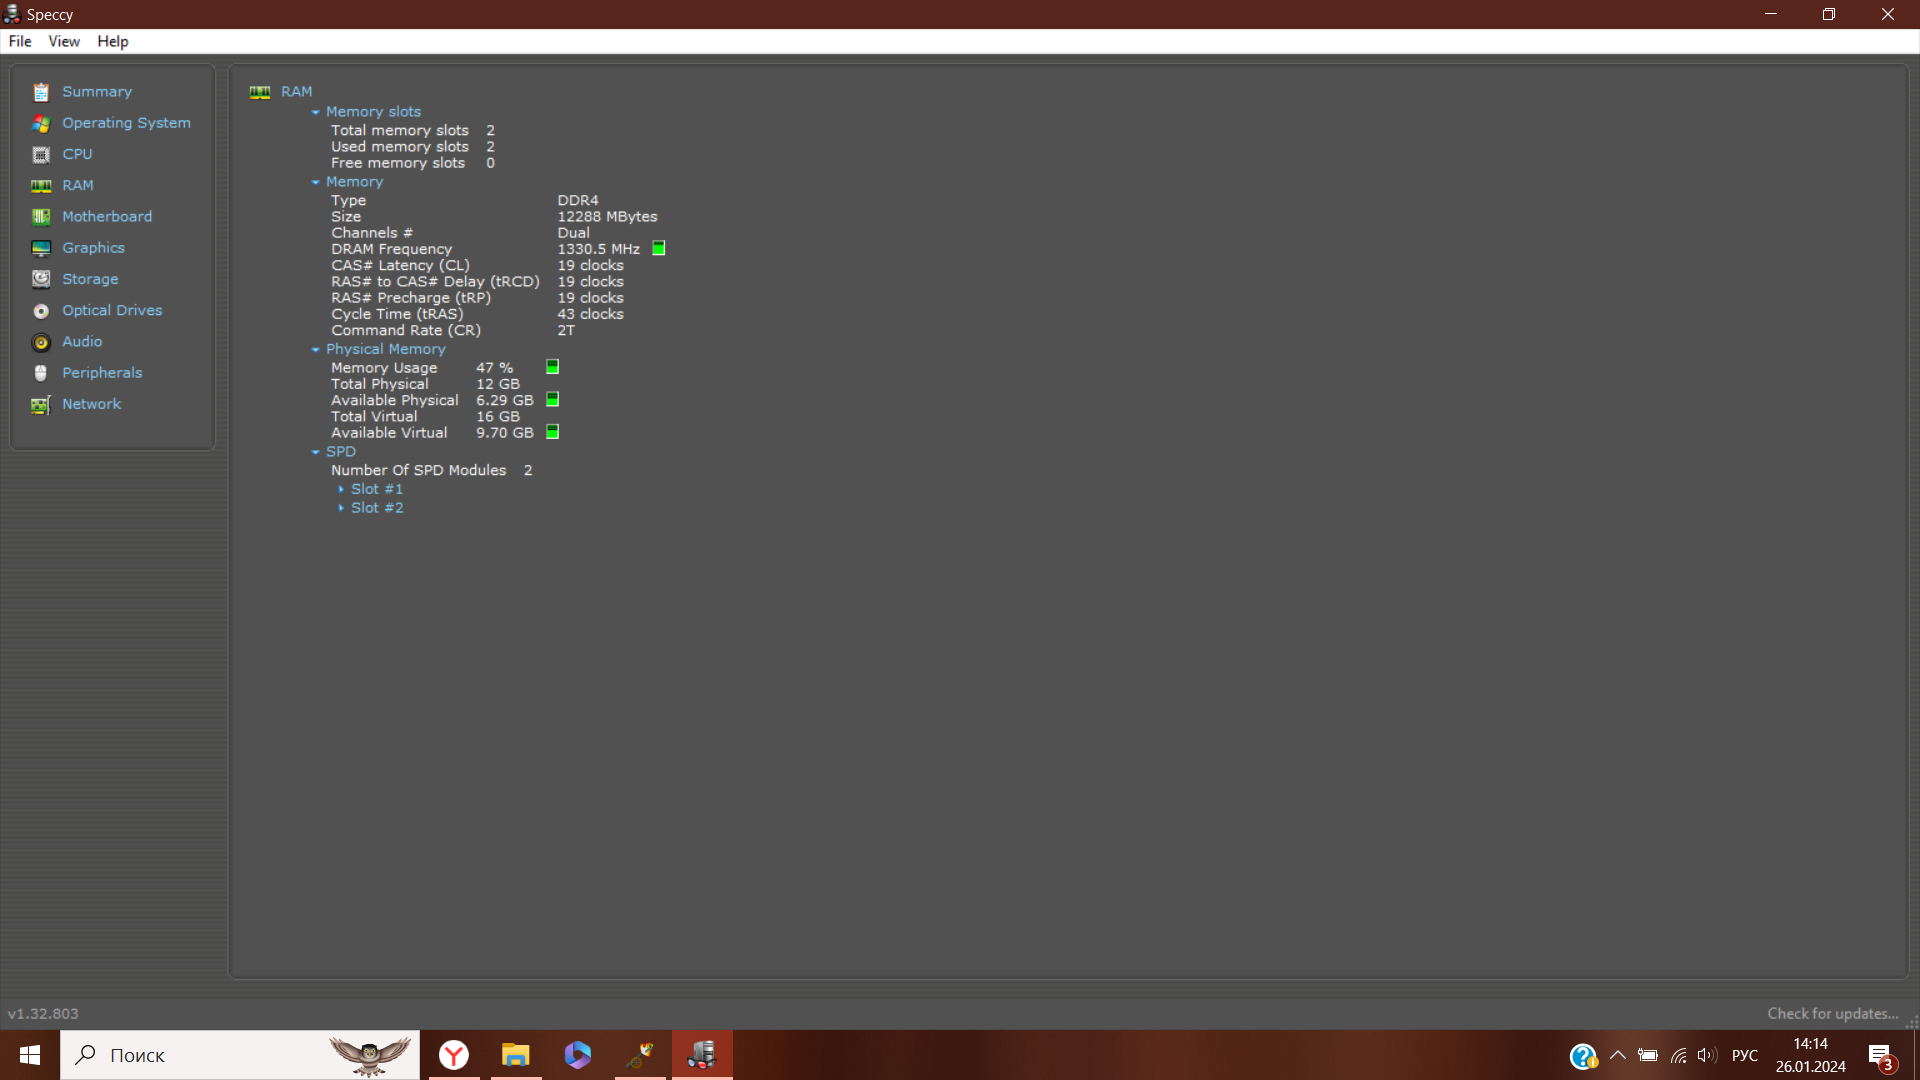
12 гб озу (4+8 Samsung M471A5244CB0-CTD)
Задавал аналогичный вопрос на других форумах, но везде молчание. Поэтому надеюсь на вашу помощь.
Что нужно исправить?