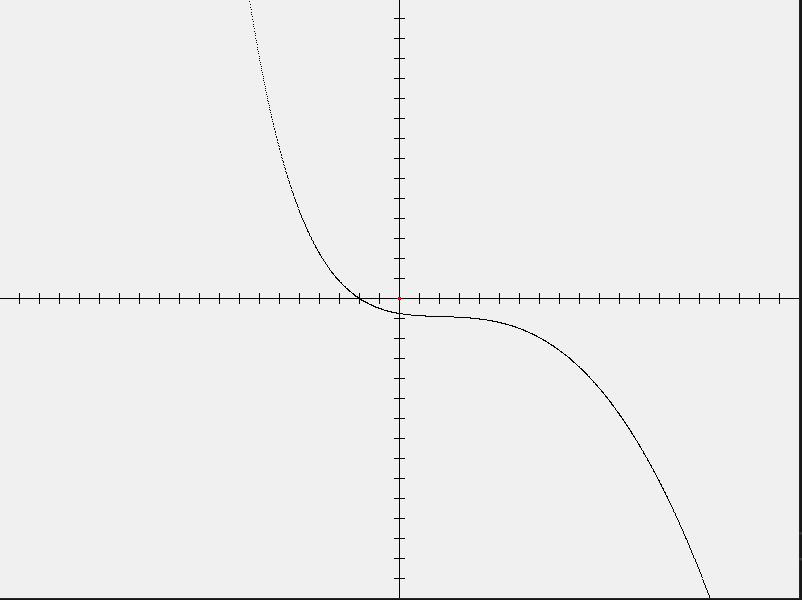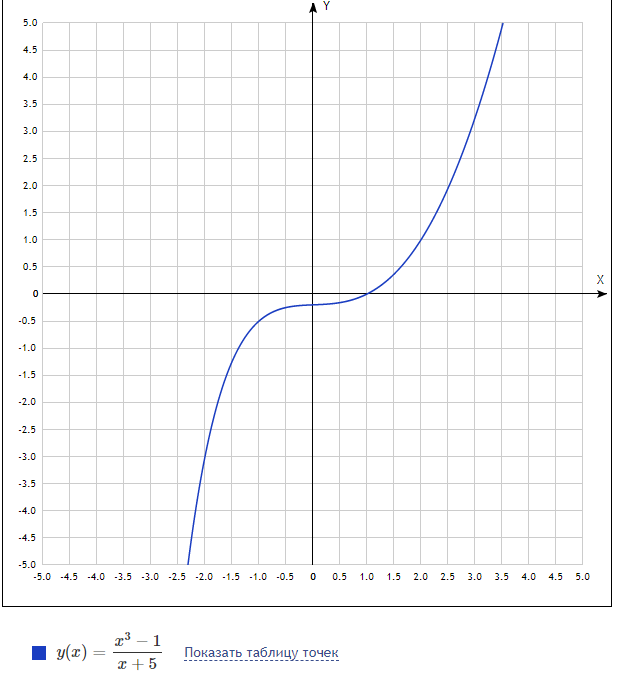

public partial class DrawWindow : Form
    {

        public DrawWindow()
        {
            InitializeComponent();
            pictureBox1.Paint += PictureBox1_Paint;
            //pictureBox1.Paint += DrawWindow_Paint;
            //Paint += new PaintEventHandler(DrawWindow_Paint);
        }


        private void PictureBox1_Paint(object sender, PaintEventArgs e)
        {
            int w = pictureBox1.ClientSize.Width / 2;
            int h = pictureBox1.ClientSize.Height / 2;
            //Смещение начала координат в центр PictureBox
            e.Graphics.TranslateTransform(w, h);
            // Оси x y
            DrawGrid.DrawXAxis(new Point(-w, 0), new Point(w, 0), e.Graphics);
            DrawGrid.DrawYAxis(new Point(0, h), new Point(0, -h), e.Graphics);
            //Центр координат
            e.Graphics.FillEllipse(Brushes.Red, -2, -2, 4, 4);

            DrPlot(e.Graphics);

            Circle.BresenhamCircle(e.Graphics,Color.Black, 1, 1, 5);
            Line.Bresenham4Line(e.Graphics, Color.Black, -5, 5, 6, 10);
        }


        private void DrPlot(Graphics Grf)
        {
            Plot MyPlot = new Plot();
            double x;
            double y;
            MyPlot.ClientArea = this.ClientSize;
            MyPlot.SetPlotPort(-5, 5, -5, 5);
            for (x = -5.0; x < 5; x += 0.005)
            {
                //MyPlot.PlotPixel(x, y, Color.Black, Grf);
                if (x + 5 != 0)
                {
                    y = (Math.Pow(x, 3) - 1) / (x + 5);
                    MyPlot.PlotPixel(x, y, Color.Black, Grf);
                    //Circle.PutPixel(Grf, Color.Black, (int)x, (int)y, 255);
                }
                else
                    continue;
            }

        }
}class Plot
{
struct PlotPort
{
public int minX;
public int maxX;
public int minY;
public int maxY;
};
private PlotPort _PlotW; //"window" of carthesian coordinates
private Size _ClientArea; //keeps the pixels info
private double _Xspan;
private double _Yspan;
public Plot() { }
public Plot(Size Plotarea)
{
_ClientArea = Plotarea;
}
public Size ClientArea { set { _ClientArea = value; } }
public void SetPlotPort(int minx, int maxx, int miny, int maxy)
{
//set the bounderies of the form(screen) to real coordinates.
_PlotW.minX = minx;
_PlotW.maxX = maxx;
_PlotW.minY = miny;
_PlotW.maxY = maxy;
_Xspan = _PlotW.maxX - _PlotW.minX;
_Yspan = _PlotW.maxY - _PlotW.minY;
}
public void PlotPixel(double X, double Y, Color C, Graphics G)
{
//workhorse of this class
Bitmap bm = new Bitmap(1, 1);
bm.SetPixel(0, 0, C);
G.DrawImageUnscaled(bm, ToX(X), ToY(Y));
}
private int ToX(double X) //transform real coordinates to pixels for the X-axis
{
double w;
w = _ClientArea.Width / _Xspan * X + _ClientArea.Width / DrawGrid.PIX_IN_ONE;
return Convert.ToInt32(w);
}
private int ToY(double Y) //transform real coordinates to pixels for the Y-axis
{
double w;
w = _ClientArea.Height / _Yspan * Y + _ClientArea.Height / DrawGrid.PIX_IN_ONE;
return Convert.ToInt32(w);
}
}using System;
using System.Drawing;
using System.Drawing.Drawing2D;
using System.Windows.Forms;
namespace DrawPlot
{
public partial class MainForm : Form
{
// Добавил сюда, чтобы в InitializeComponent не лезть
PictureBox picDisplay;
// Макс размер сетки по наибольшему измерению окна
// для сохранения пропорции (либо по ширине, либо по высоте)
const float MaxGrid = 10.0f;
// Это задаёт логический размер окна
SizeF viewPort;
// Шаги сетки
const float GridStep = 0.1f;
// Каждые 10 линий сетки делаем линию поярче
const int BoldLineStep = 10;
// Цвета
Pen pen_LargeGrid = new Pen(Color.FromArgb(0,64,0));
Pen pen_SmallGrid = new Pen(Color.FromArgb(0,32,0));
Pen pen_Axii = new Pen(Color.FromArgb(0,128,0));
SolidBrush plotBrush = new SolidBrush(Color.Red);
// Ширина 1 пиксела в логических размерах
float Pixel_Width;
public MainForm()
{
InitializeComponent();
picDisplay = new PictureBox() { Parent = this, Dock = DockStyle.Fill, BackColor = Color.Black };
picDisplay.Paint += this.PicDisplay_Paint;
picDisplay.Resize += this.PicDisplay_Resize;
// Стрелочка 10х4
AdjustableArrowCap cap = new AdjustableArrowCap(4.0f,10.0f);
pen_Axii.CustomEndCap = cap;
CalculateDimensions();
} // MainForm Ctor
private void PicDisplay_Resize(object sender, EventArgs e)
{
CalculateDimensions();
picDisplay.Invalidate();
} // PicDisplay_Resize
private void CalculateDimensions()
{
var rect = picDisplay.ClientRectangle;
// Устанавливаем размеры в зависимости от того, что больше, длина или ширина
// для сохранения квадратной сетки
if (rect.Width > rect.Height)
viewPort = new SizeF(MaxGrid, MaxGrid * (rect.Height / (float)rect.Width));
else
viewPort = new SizeF(MaxGrid * (rect.Width / (float)rect.Height), MaxGrid);
// Считаем ширину 1 пикселя
Pixel_Width = viewPort.Width / rect.Width;
// Назначаем эту ширину используемым перьям
foreach (var pen in new Pen[] { pen_Axii, pen_LargeGrid, pen_SmallGrid, pen_LargeGrid })
pen.Width = Pixel_Width;
} // CalculateDimensions
private void PicDisplay_Paint(object sender, PaintEventArgs e)
{
Graphics g = e.Graphics;
// Масштабируем
g.ScaleTransform(picDisplay.Width / viewPort.Width, (picDisplay.Height / viewPort.Height));
// Двигаем начало координат в середину
float halfWidth = viewPort.Width / 2;
float halfHeight = viewPort.Height / 2;
g.TranslateTransform(halfWidth, halfHeight);
// Переворачиваем Y
g.ScaleTransform(1.0f, -1.0f);
// Рисуем сетку
int step = 0;
for(var f = 0f; f < MaxGrid / 2 ; f += GridStep)
{
var currentPen = pen_SmallGrid;
if (0 == step % BoldLineStep) currentPen = pen_LargeGrid;
// Горизонтальные
g.DrawLine(currentPen, -halfWidth, f, halfWidth, f);
g.DrawLine(currentPen, -halfWidth, -f, halfWidth, -f);
// Вертикальные
g.DrawLine(currentPen, f, -halfHeight, f, halfHeight);
g.DrawLine(currentPen, -f, -halfHeight, -f, halfHeight);
step++;
} // for
// Оси координат
g.DrawLine(pen_Axii, -halfWidth, 0, halfWidth, 0);
g.DrawLine(pen_Axii, 0, -halfHeight, 0, halfHeight);
// график
float y;
for (var x = -halfWidth ; x < halfWidth ; x+= Pixel_Width)
{
y = ((float)Math.Pow(x, 3) - 1) / (x + 5);
// Обязательно проверка на NaN и Infinity
if (!float.IsNaN(y) && !float.IsInfinity(y))
g.FillRectangle(plotBrush, new RectangleF(x, y, Pixel_Width, Pixel_Width));
} // for
} // PicDisplay_Paint
} // class MainForm` 1+m
} // DrawPlot namespace