import matplotlib.pyplot as plt

x = [1, 2, 3, 4, 5, 6]
y = [8, 13, 14, 11, 16, 22]
plt.plot (x, y)
plt.xlabel('X Variable')
plt.ylabel('Y Variable')
plt.savefig('my_plot.tiff')import matplotlib.pyplot as plt
from PIL import Image
import io
png1 = io.BytesIO()
png2 = io.BytesIO()
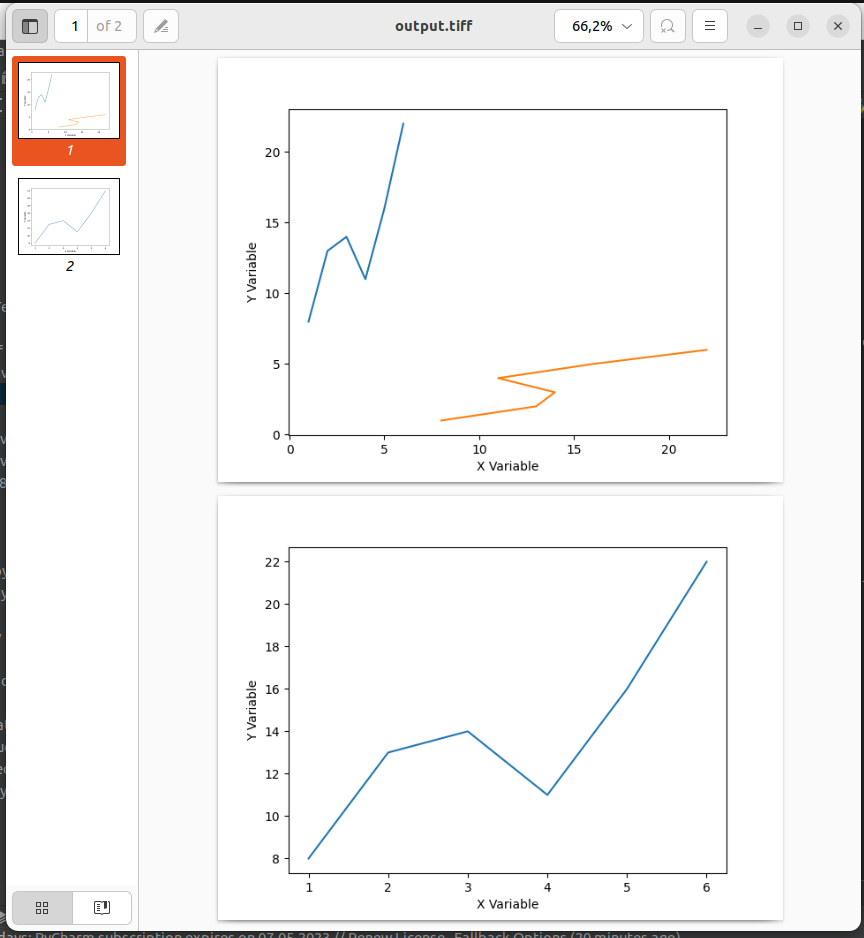
x = [1, 2, 3, 4, 5, 6]
y = [8, 13, 14, 11, 16, 22]
plt.plot (x, y)
plt.xlabel('X Variable')
plt.ylabel('Y Variable')
plt.savefig(png1)
y_1 = [1, 2, 3, 4, 5, 6]
x_1 = [8, 13, 14, 11, 16, 22]
plt.plot (x_1, y_1)
plt.xlabel('X Variable')
plt.ylabel('Y Variable')
plt.savefig(png2)
im = Image.open(png1)
im1 = Image.open(png2)
im1.save("output.tiff", format="tiff", append_images=[im], save_all=True, duration=500, loop=0)