<script type="text/javascript">
    google.charts.load("current", { packages: ["corechart"] });
    google.charts.setOnLoadCallback(drawChart);

    function drawChart() {

      var data = new google.visualization.arrayToDataTable([
        ["Year", "Sales", "Expenses"],
        ["2004", 1000, 400],
        ["2005", 1170, null],
        ["2006", 660, 1120],
        ["2007", 1030, 540],
      ]);

      var options = {
        title: "Company Performance",
        //curveType: "function",
        legend: { position: "bottom" },
      };

      var chart = new google.visualization.LineChart(
        document.getElementById("report")
      );

      chart.draw(data, options);
    }
  </script>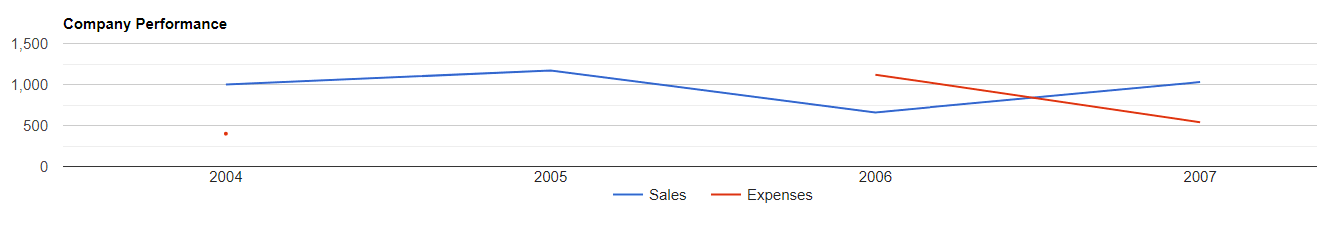
["Year", "red", "blue"],
["1", 2, 4],
["2", 2, 4],
["3", 7, 2],
["4", null,2],
["5", null, 5],
["6", 3, 6],
["7", 4, 5]
"вот жеж блин" - когда ответ есть перед глазами, и вопрос очень простым кажется ...