

var ctx = document.getElementById('myChart').getContext('2d');
Chart.defaults.global.defaultFontColor = '#d1d1d1';
Chart.defaults.global.defaultFontSize = '16';
Chart.defaults.global.defaultFontFamily = 'Montserrat';
Chart.defaults.global.defaultFontStyle = 'bold';
var chart = new Chart(ctx, {
// The type of chart we want to create
type: 'line',
// The data for our dataset
data: {
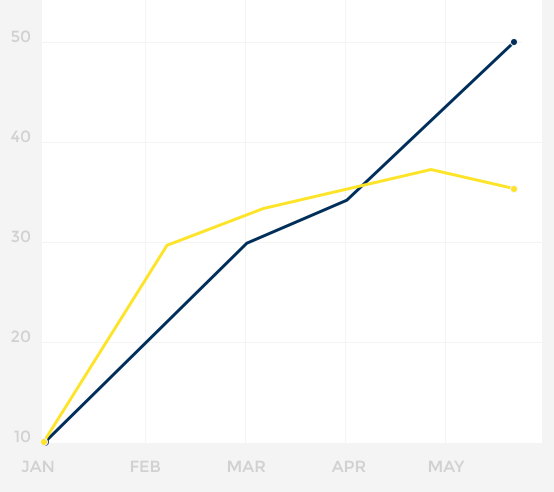
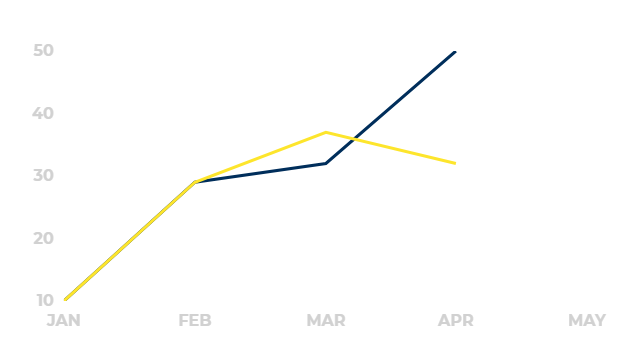
labels: ["JAN", "FEB", "MAR", "APR", "MAY"],
datasets: [
{
label: "My First dataset",
backgroundColor: '#FDE52C',
fill: false,
borderColor: '#FDE52C',
borderWidth: 3,
data: [10,29,37,32],
},
{
label: "My First dataset",
backgroundColor: '#002E5B',
fill: false,
borderColor: '#002E5B',
borderWidth: 3,
data: [10,29,32,50],
}
]
},
options: {
responsive: true,
legend: {
display: false,
},
scales: {
xAxes: [{
gridLines: {
display: false,
drawBorder: false
} ,
}],
yAxes: [{
gridLines: {
display: false,
drawBorder: false
},
ticks: {
min: 10,
max: 50,
stepSize: 10
}
}]
},
elements: {
line: {
tension: 0.000001
},
point: false
}
}
});
Получилось вот, что
 Сложный
Средний
Сложный
Сложный
Средний
