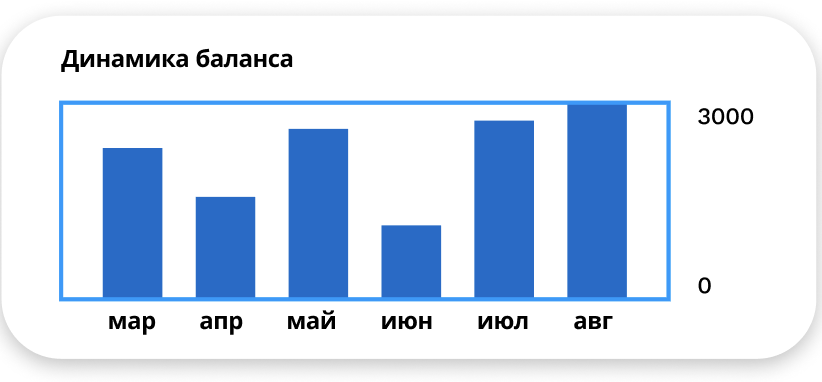
new Chart(canvas, {
    type: 'bar',
    data: {
        labels: ['Red', 'Blue', 'Yellow', 'Green', 'Purple', 'Orange'],
        datasets: [{
            // label: '# of Votes',
            data: [12, 19, 3, 5, 2, 3],
            backgroundColor: '#116ACC',
        }]
    },
    options: {

      scales: {
        y: {
          position: 'right',
          grid: {
            display: false
          },

          ticks: {
            color: 'black',
            font: {
              size: '20'
            },
          }
        },
        x: {
          grid: {
            display: false
          },
          ticks: {
            color: 'black',
            font: {
              size: '20'
            }
          }
        }
      },
      plugins: {
        legend: {
          display: false,
        },
      },
      layout: {
        padding: {

        }
      }
    },
    plugins: [
      {
        beforeDraw(chart, args, options) {
          const {ctx, chartArea: {left, top, width, height}} = chart;
          ctx.save();
          ctx.strokeStyle = options.borderColor;
          ctx.lineWidth = 1;
          ctx.setLineDash(options.borderDash || []);
          ctx.lineDashOffset = options.borderDashOffset;
          ctx.strokeRect(left, top, width, height);
          ctx.restore();
        }
      }
    ]
  })

Вот мои настройки графика. Как убрать промежуточные значения в оси Y и оставить только минимальное и максимальное значение как на картинке ниже?


