@anriko

Как не по делениям ,а по ориентировочным линиям сделать градиент в chartjs?

значение линий ориентира беруться из админки ,положение линий ориентиров на разных графиках разное, хочу сделать от первой синей до последней голубой зеленым

609fe119674b9654216850.png
<script src="https://cdn.jsdelivr.net/npm/chart.js"></script>
<script src="https://cdnjs.cloudflare.com/ajax/libs/chartjs-plugin-annotation/1.0.1/chartjs-plugin-annotation.min.js"></script>
<canvas id="myChart2" width="502" height="262" style="display: block; box-sizing: border-box; height: 262px; width: 502.3px;"></canvas>
<script>
                  function myChart(){
                var ctx = document.getElementById('myChart2').getContext('2d');

                   
                var marketing = [20, 37];
                var amount = [20, 37];
                var marketing2 = [25, 30];
                var amount2 = [25, 30];
                // populate 'annotations' array dynamically based on 'marketing'
                var annotations1 = marketing.map(function (date, index) {
                    return {
                        type: 'line',
                        id: 'vline' + index,
                        mode: 'horizontal',
                        scaleID: 'y-axis-0',
                        value: date,
                        borderColor: '#006F93',
                        borderWidth: 2,
                        yMin: date,
          				yMax: date,
                        label: {
                            enabled: true,
                            position: "center",
                            content: amount[index]
                        }
                      
                    }
                });
              var annotations2 = marketing2.map(function (date, index) {
                    return {
                        type: 'line',
                        id: 'vline' + index+1,
                        mode: 'horizontal',
                        scaleID: 'y-axis-0',
                        value: date,
                        borderColor: '#00CFD7',
                        borderWidth: 2,
                        yMin: date,
          				yMax: date,
                        label: {
                            enabled: true,
                            position: "center",
                            content: amount2[index]
                        }
                      
                    }
                });
                  var annotations = annotations1.concat(annotations2); 
                      console.log(annotations); 


                var myChart = new Chart(ctx, {
                    type: 'line',
                    data: {
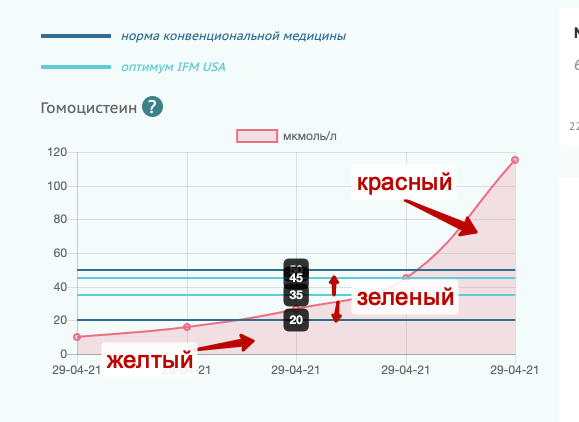
                        labels: ["29-04-21","29-04-20","29-04-17","29-04-16","29-04-15"],
                        datasets: [{
                            label: "мкмоль/л",
                            data: ["5","10 ","20","10","45"],
                            
                            borderWidth: 2
                        }]
                    },
                    options: {
                     datasets:{
                        	line:{
                          	backgroundColor:function(context){
                  
                   console.log(context.chart.chartArea);
                 // console.log(context.chart.scales.y.ticks);
                  debugger;
                 
                    
                            		let ctx = context.chart.ctx;
                         	       let gradient = ctx.createLinearGradient(0, context.chart.scales.y.bottom || 0,0, -context.chart.scales.y.paddingTop || 0,0);
                              gradient.addColorStop(0, 'yellow');   
                        gradient.addColorStop(0.44444444444444, 'yellow');/ это 20/45
                        gradient.addColorStop(0.44444444444444, 'green'); / это 20/45
                        gradient.addColorStop(0.66666666666667, 'green');/ это 30/45
                        gradient.addColorStop(0.66666666666667, 'red');/ это 30/45
                        gradient.addColorStop(1, 'red');
                                return gradient;
                            },
                            fill:true
                          }
                        },
                        scales: {
                            x: {
                                beginAtZero: true,
                                ticks: {
                                    color: 'red',
                                },
                                grid: {
                                    borderColor: 'red'
                                }
                            },
                            y: {
                                stacked: true,
                                title: {
                                    display: true,
                                    text: "мкмоль/л",
                                    color: 'red',
                                    ticks: {
                                        color: 'red',
                                    }
                                }
                            }
                        },
                           plugins: {
                        annotation: {
                            drawTime: 'afterDatasetsDraw',
                            annotations: annotations
                        }}
                    }
                });
                    }
                  myChart();
           
            </script>
  • Вопрос задан
  • 56 просмотров
Пригласить эксперта
Ваш ответ на вопрос

Войдите, чтобы написать ответ

Войти через центр авторизации
Похожие вопросы