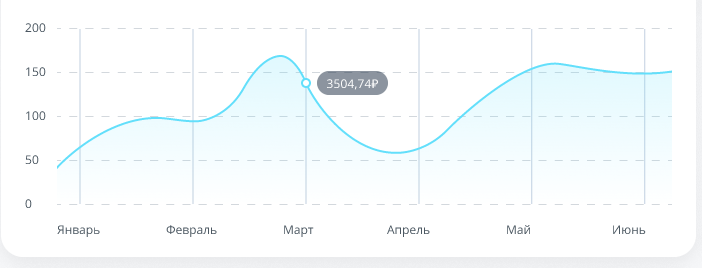
Хочу сделать в графике градиент, но что-то не могу понять как. Вот что у меня сейчас получается,

а нужен вот такой график.

Может я вообще не ту библиотеку использую...
вот мой код.
<!DOCTYPE html>
<html lang="en">
<head>
    <meta charset="UTF-8">
    <meta http-equiv="X-UA-Compatible" content="IE=edge">
    <meta name="viewport" content="width=device-width, initial-scale=1.0">
    <script src="https://code.highcharts.com/highcharts.js"></script>

    <style>
        #container {
        height: 400px;
    }

    .highcharts-figure, .highcharts-data-table table {
        min-width: 310px;
        max-width: 800px;
        margin: 1em auto;
    }

    .highcharts-data-table table {
        font-family: Verdana, sans-serif;
        border-collapse: collapse;
        border: 1px solid #EBEBEB;
        margin: 10px auto;
        text-align: center;
        width: 100%;
        max-width: 500px;
    }
    .highcharts-data-table caption {
        padding: 1em 0;
        font-size: 1.2em;
        color: #555;
    }
    .highcharts-data-table th {
      font-weight: 600;
        padding: 0.5em;
    }
    .highcharts-data-table td, .highcharts-data-table th, .highcharts-data-table caption {
        padding: 0.5em;
    }
    .highcharts-data-table thead tr, .highcharts-data-table tr:nth-child(even) {
        background: #f8f8f8;
    }
    .highcharts-data-table tr:hover {
        background: #f1f7ff;
    }
    .highcharts-title{
      font-family: Poppins, sans-serif;
      font-style: normal;
      font-weight: normal;
      font-size: 10px!important;
      line-height: 15px;
      letter-spacing: 0.01em;
      color: #192A3E!important;
      fill: #192A3E!important;
      position: relative;
    }
    .highcharts-title::before{
      content: 'qwe';
      position: absolute;
      top: 0;
      left: 0;
    }

    </style>


    <title>Document</title>
</head>
<body>
  <div id="container"></div>


   <script>
    Highcharts.chart('container', {
    chart: {
        type: 'areaspline',
    },
    title: {
        text: 'Инвестиции за период',
        align: 'left',
    },

    xAxis: {
      gridLineWidth : 1,
      categories: [
          'Январь',
          'Февраль',
          'Март',
          'Апрель',
          'Май',
          'Июнь',
          'Июль'
      ],
    },
    yAxis: {
      gridLineWidth : 1,
      title: {
          text: ''
      },
      gridLineDashStyle: 'longdash'
    },
    tooltip: {
        shared: true,
        valueSuffix: ' ₽'
    },
    credits: {
        enabled: false
    },
    plotOptions: {
        areaspline: {
            fillOpacity: 0.5
        }
    },
    series: [{
      name: '',
      data: [300.22, 402.26, 385.89, 556.56, 412.38, 100.15, 120.22]
    }]
});
   </script>

</body>
</html>

