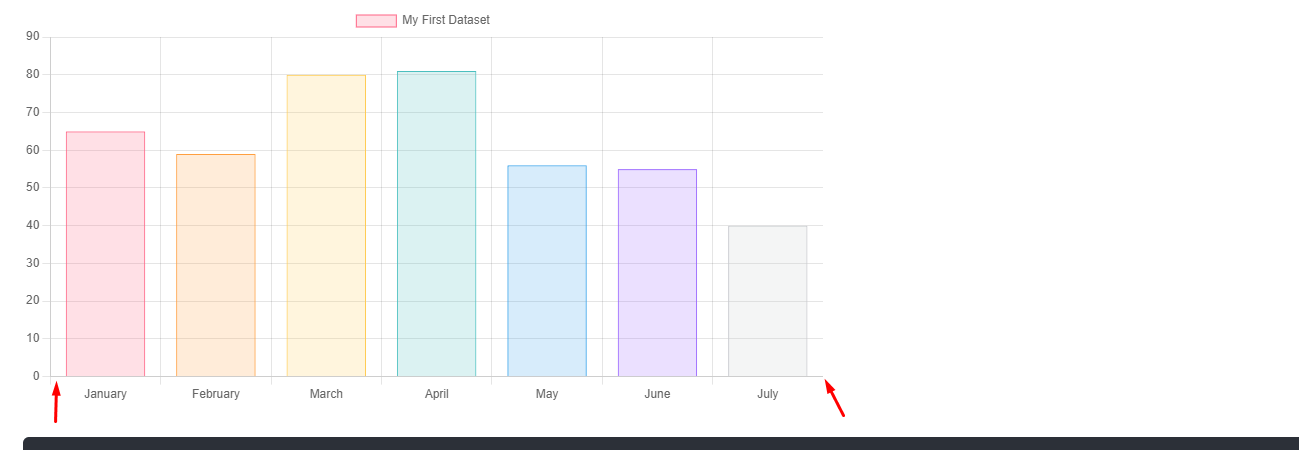
data: {
  labels: ['Red', 'Blue', 'Yellow', 'Green', 'Purple', 'Orange'],
  datasets: [{
    label: '# of Votes',
    data: [12, 19, 3, 5, 2, 3],
    categoryPercentage: 1,
    barPercentage: 1,
    borderColor: "rgba(0,0,0,0)",
    borderWidth: [ { left: 0, right: 30 }, 30, 30,30, 30, { left: 30, right: 0 } ],
  }]
}