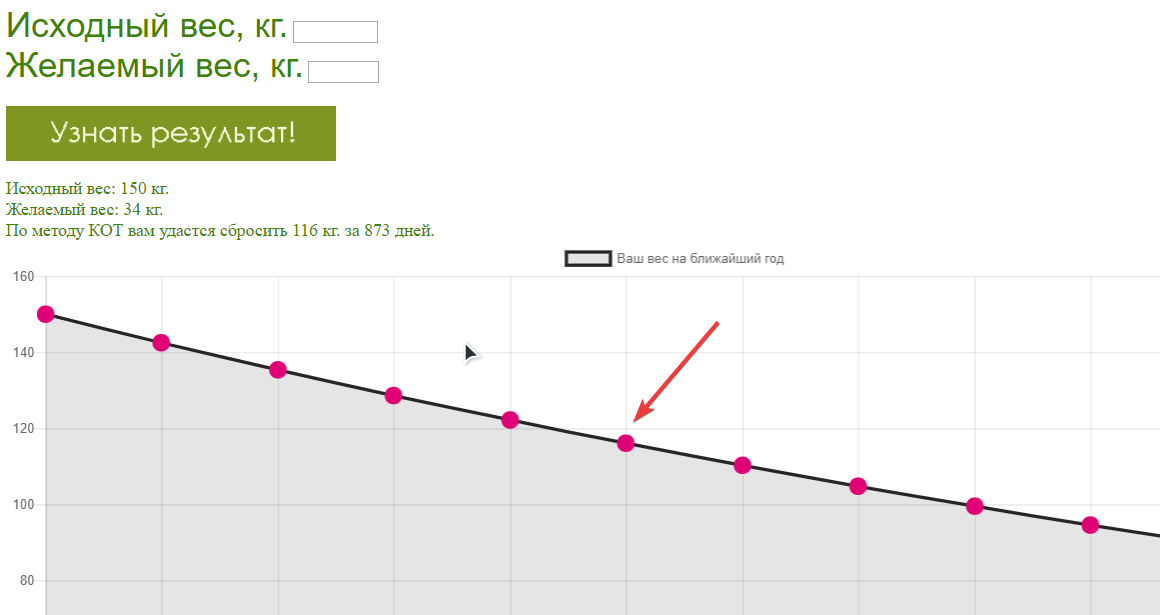
Сделал калькулятор для сайта, результаты которого выводятся на график от Chartjs
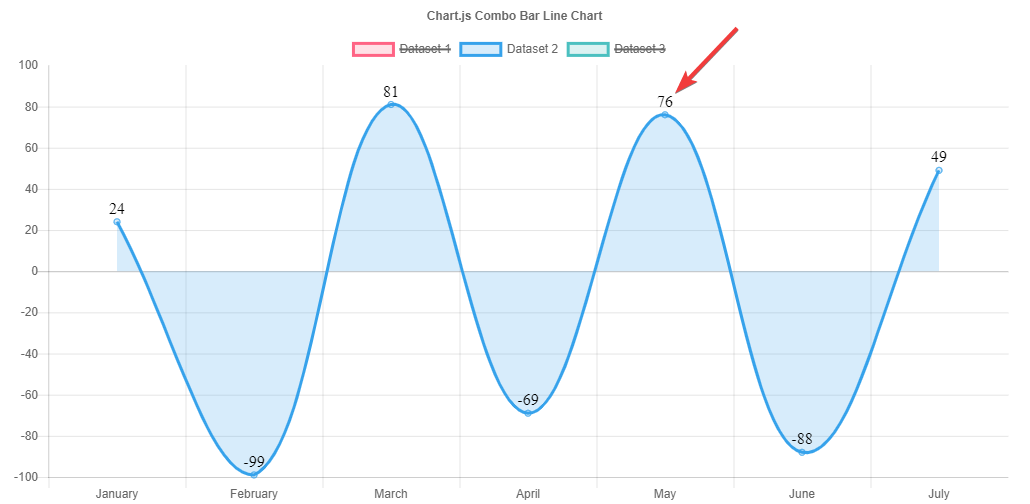
Не получается сделать так:

Хочу сделать такой же вывод здесь.

Мой код:
var ctx = document.getElementById('myChart').getContext('2d');
var chart = new Chart(ctx, {
    // The type of chart we want to create
    type: 'line',

    // The data for our dataset
    data: {
        labels: [arr1[mm],arr1[mm+1],arr1[mm+2],arr1[mm+3],arr1[mm+4],arr1[mm+5],arr1[mm+6],arr1[mm+7],arr1[mm+8],arr1[mm+9],arr1[mm+10],arr1[mm+11]],
        datasets: [{
        	label: "Ваш вес на ближайший год",
            //backgroundColor: 'rgb(127,150,34)',
            pointBackgroundColor:'#e00176',
            borderColor: '#262626',
            pointBorderWidth: '10',
            pointBorderColor: '#e00176',
            data: [arr[0],arr[1],arr[2],arr[3],arr[4],arr[5],arr[6],arr[7],arr[8],arr[9],arr[10],arr[11],0]
        }]
    },

    // Configuration options go here
    options: {

    }
});


